NNA wants to help spread as much awareness as possible that the City of Houston is in the public feedback period of our design guidelines. Guidelines were set as required for each neighborhood in Houston that falls under the Historic Ordinance. We urge all residents to look both at the measurable standards in the draft document and to examine the plots and data provided that snapshot where our neighborhood currently sits. We ask that you provide feedback on Let’s Talk Houston. It is critical that your voices (affirmative or otherwise) are heard.
Guidelines Adoption Process
Please see the flowchart below that will outline the proposed steps that will be taken both by the city and the neighborhood to both solicit public feedback and approval.

Additional comments from the NNA President:
The neighborhood board pulled data from HCAD and took pictures throughout the neighborhood to try to provide residents with as much information as possible when asking you to provide feedback on what are reasonable measureable standards within Historic Norhill. We feel that we, as residents, are a valuable resource in deciding guideline language. We spent the time to pull all of this data together because we think the adoption of the guidelines is so critical not only in preserving the character of our neighborhood but also to arm our residents with a fair and reasonable set of clear standards to use when planning their own renovations. Your participation in this process is critical to the success of these guidelines. All representations are portrayed based on the information we currently had at the time of making the presentation materials.
The following table shows the lot size distribution for Historic Norhill (broken out by East and North Norhill). You can see from the table that over 90% of the residences are on lots between 5000-5999 sqft.

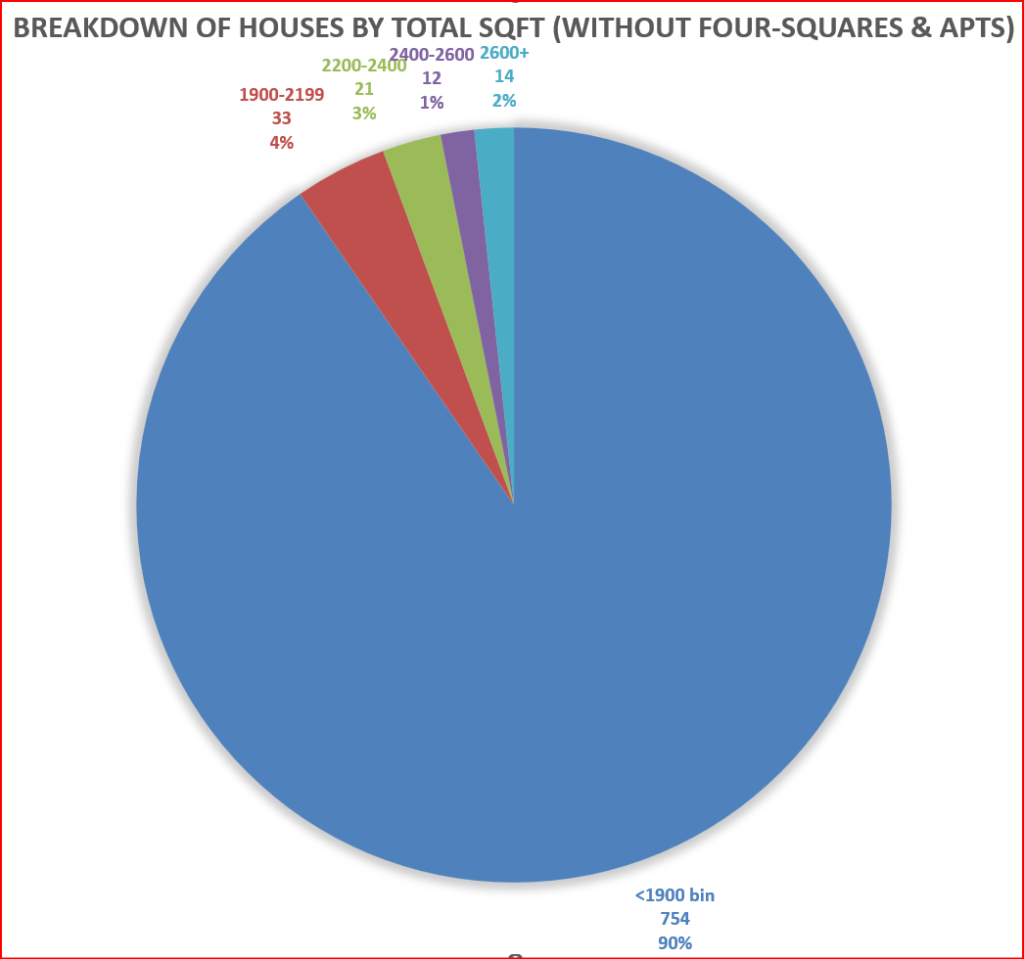
Focusing on the lots between 5000-5999 square feet, the following table illustrates the size of residence square footage. The table shows what percentage of those 5000-5999 square foot lots (n=708) have residences above a certain square footage. We feel this is critical for the residents to understand what currently exists when deciding what each of you feel is a reasonable maximum square footage for a residence. This total square footage includes properties that have a second residence grandfathered in. Seven of these properties are historic four-squares. If we counted only the primary residence, these numbers drop even lower. The below pie chart is another way to view this data.


I would also like to provide some additional data on another neighborhood (Historic Heights) whose guidelines were adopted by the city in July 2018). The Houston Historic Heights Design Guidelines illustrate how critical it is to consider each neighborhood on a case-by-case basis. The Historic Heights neighborhood differs from Norhill in many ways. But, I would argue that one of the most important ways relevant to this conversation is that it provides a snapshot of what was existing (regarding residence square footage) when their maximum square footages were applied. The following table is from HCAD data pulled for the Houston Historic Heights (Houston Heights East, Houston Heights West, and Houston Heights South). This takes into account the residence’s lot size, living area, and garage square footages. It illustrates what percentage of houses existed that exceed the maximum square footages that were applied when their guidelines were adopted. Norhill is much more historically intact that the Historic Houston Heights. The question I ask you, as Norhill residents, to consider is don’t we deserve the same amount of protection (if not more) than the Historic Houston Heights?

Less than 10% is a typical threshold in historic preservation. The Norhill draft guidelines have measureable standards that still include more than 90% of houses in the neighborhood. The Houston Heights went even further and used the remaining 60-80% of the houses to retain the character of that neighborhood. It is critical in historic preservation to concentrate on the majority not on the few exceptions. Our minds go to the few percentages of large houses in part because those houses stand out. The fact that they standout, in my opinion, is further proof that they are not the right size to define and retain Norhill’s historic character. It is also why the Historic Norhill draft guidelines are currently at a maximum ratio of living area to lot size of 0.38. For the 5000-5999 lot size, this would allow a house between 1900 sqft and 2242 sqft depending on the lot size.
These allow for good size 3 bedroom, 2 bath or even more within the home and find the balance between historic preservation and modern growth. Keep looking in this space to see some examples of generic architecture plans.